This is an initial post on a little project I have with monitoring the power (electricity) usage here at home. But first, a bit of background, and smart meters.
Smart meters
In my last house I was, like most people, constantly badgered to have a smart meter. I did have one installed eventually, as it happens. But what is especially odd is the way they are marketed - as "money saving". From what I can tell the main "money saving" aspect is simply that you know how much power you are using in real time, and so can make savings by using less power. You don't need a smart meter for that (as you will see below).
Now, there are other aspects - notably there are now some companies with some special tariffs. My son's is a good example as he has a period over night with very cheap (5p) electricity for charging his car. That alone could be done with a classic "economy 7" type meter, but some of these tariffs are more dynamic, and even link to the car to tell it when it can charge, offering even better tariffs. So yes, there are some ways a smart meter can be advantageous. If you don't have an EV, then maybe less so, just saving using a night tariff for washing machine, tumble dryer, or other high usage stuff, but that is not always as simple as it sounds.
Of course the big downside, that they don't mention, is that the smart meter has a contactor that means the power can be remotely turned off. This is a danger because it can happen by mistake (people mistakenly switched to pre-pay tariff without any means to pre-pay), or because of hacking, which is always a risk. I suspect if that was explained there would be a lot less take up.
But what really does annoy me is how smart meters can so easily become dumb. Shortly after getting one, I switched to another energy provider who simply could not use the smart meter - so no special tariffs, and having to submit meter readings.
When I moved to my new house, there was already a smart meter in place (only for electricity though), and surprise surprise it too was dumb, with the power company I was using (a different one again) unable to read it, and so I have to submit readings.
So, without the detailed live reporting, and finding that the electricity bill is quite high here, and expecting a significant increase in per unit costs, I decided to look in to our usage and see how to make some savings.
 Energy monitoring
It turns out that a bit of energy monitoring is not that hard. I have seen projects to watch the blinking light on the meter, but that means power to such as device, and our meter is in a cupboard on the outside, so not easy. What is simple is using a current clamp.
I am using the Shelly EM devices, these can take two clamps per device.
As usual, the Shelly software that comes with it is perfectly adequate. There is also software you can get that integrates with Apple HomeKit. However, for consistency of the various IoT devices I have (over 100), I re-flashed with tasmota software.
The energy metering is logged to MQTT nicely, and so easy for me to code logging and graphing of the data.
Using one of these, and the 120A clamp (there are 50A and 120A which are simply for different size cables) it is easy to clamp the main incoming tail, and get total electricity usage. But that would only give me as much detail as a smart meter, and I wanted more. So I put five of the Shelly EM, a total of 10 clamps, in a deep two gang back box below my consumer unit, and fitted 10 clamps.
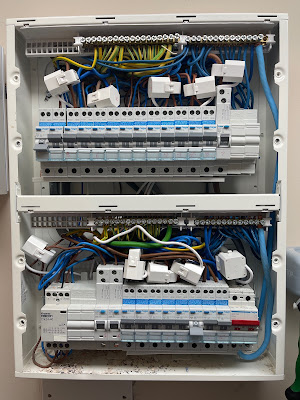
This is not quite enough to monitor all usage, and in some cases multiple circuits go via one clamp, but it has allowed me to break down my usage pretty cleanly in to different areas of usage in the house, and so make some changes.
Making some graphs
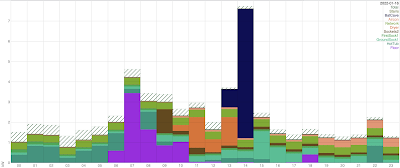
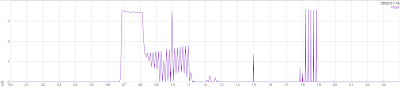
Having data sent to MQTT made it easy to log the usage to a database, and so make graphs (in SVG), which can be for multiple sensors, for a day, a month, a year, etc. So the graph above is one day. By colour coding each area some usage really does stand out.
Consistency
The first thing I wanted to do was make sure the metering was consistent. The hatched area is the total, from the incoming tail, and shows at the top where the various other values add up to less than the total. This initially puzzled me as only the lights were not being monitored and it was around 500W difference which was way too much for that. It also seemed to be all day and night.
It turned out one wire was missing on the air con clamp, meaning that (over night) was missed, and also one set of sockets was missed out, impacting all day. Once these were fixed (part way through that day) the discrepancy is nice and clean - almost zero over night as typically one light is on, and a very sane low level for the lights during the day. So I am happy the measurements are consistent now.
Just looking at that one day, you will note some big green blocks on the left, some purple, and a lot of dark blue. These are hot tub, heated floor, and bat cave respectively. But let's break down some of the usage in more detail.
Hot tub
The hot tub is one concern we already had. Shutting down a hot tub is not a simple matter, especially if it is outside where things could freeze. Also, there is no reason not to use it in the winter (even though it is outside), but perhaps not as often. So saving money is not so simple - but understanding how much it uses is useful.
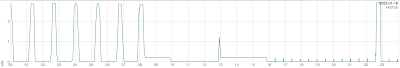
The usage will depend on the temperature, and is mostly just keeping it to temperature with the heater. It is well insulated. When idle, its usage is around 14kWh/day (i.e. around 580W average). At present that is about £70/month, but will go up soon. Not ideal, and clearly something we could consider shutting down if ever we needed to.
One idea was keep it running but at a lower temperature. That does work, indeed it was tested during that day hence the usage mostly being in the morning. The impact was half a day of no heating as the temperature dropped (we set 5C lower), but then the ongoing heating the next day was very similar to that at the higher temperature (only slightly longer gaps). I suspect if we lowered it as low as is sensible we could indeed save power, but if we are still using it some of the time, that is not really going to help. It can take a couple of hours solidly heating to get back to temperature, so using every couple of days it will probably negate a lot of the savings made.
FYI, we noted it only uses 11A heating, and were surprised at the rather beefy installation. This is until we turned on the pumps! It has several jets, and when all on, and the heater on, it can, indeed, pull over 28A. I guess pumping water takes a lot of power. Worth noting. It also has some low usage for circulation pumps that it runs twice a day (and also whilst heating, by the look of it).
Heated floor
The other obvious high user was the fact we have an electric heated floor in the kitchen. It is slate tiles, but this is also the only heating in that room if the door is closed, which is not very efficient.
The graphs made it clear that the floor was using a lot of power. It pulls 16A, and was, in the morning, using a lot.
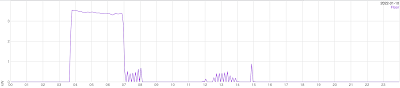
A very small change of leaving the kitchen door over night left the kitchen warmed from the gas central heating in the house, and made this a lot less demanding. But I also found the temperature sensors were not remotely calibrated, and several degrees out, and also it has an "eco" mode, which is not that clear but did change the usage, and even the clock was wrong and starting far too early in the day.
I expect some more tinkering can save some more without the floor being cold, and it depends, once again, on environmental temperature. We have got it from a worst case measured so far of 28kWh/day down to 8kWh/day now.
Bat cave
The bat cave is simple, it is an outbuilding we have, and the only thing in it is a light (switched off), a temperature sensor, and a freezer, so yes, the usage is very low all day. 0.47kWh/day (20W).
But you will have noticed on my first graph a big dark blue block... It looks like this :-
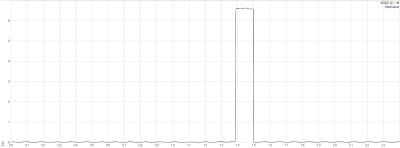
From this you can probably work out exactly when, and for how long, my son, with his EV, visited, and used the charger on the wall of the bat cave :-)
Other usage
Obviously a number of other things stand out, when used, notably the washing machine and tumble dryer. Even without separate sensors for all of these, it is very simple to see the individual use cases and get an idea of the cost of their use.
My network
I also have, in my loft, on its own circuits, a server, a NAS, fibre termination, firewalls, and switches that PoE all the access points and CCTV cameras, and various other things. This is a simple steady 8½kWh/day (350W). Not insignificant (£40/month) but worth knowing.
More?
I will post more once I have some months of data, I am sure. One of the things I am doing is fitting more of the nice Shelly Plus 1PM switches for lights and some specific devices to get more fine tuned break down of usage. I am also planning solar/battery soon, and will post on that.
The linux tools (taspowerlog and taslowersvg) are on GitHub.


'From what I can tell the main "money saving" aspect is simply that you know how much power you are using in real time, and so can make savings by using less power' - I wonder how many people actually make any changes to their usage after getting a meter put in.
ReplyDeleteIndeed it'd be interesting to see (if the meters even record this) how many can actually still see their IHDs (In Home Displays), or have people in many cases simply unplugged them and batteries run out etc as they never looked at them...
I'd be interested to see how you're powering the Shellys, any chance that you could post pictures of them and their wiring? Thanks
ReplyDeleteYou can call your supplier and replace your SMETSv1 meter with a SMETSv2 meter, that reports data to a Crapita-controlled 'DCC', which all suppliers then have to read the data from.
ReplyDeleteThe advantage of this, is that DCC can licence 'other users' for that data, and one such licensee is n3rgy, who kindly provide you with a nice API to monitor all your energy as the supplier themselves sees.
Sign up for free here: https://data.n3rgy.com/consumer/home and bob's your uncle and no need for Heath Robinson Shelley devices!
That is very cool, but won't give me anything like the detail these are providing, i.e. what individual circuits are using the power and when. However, may be a good plan, thanks.
DeleteOf course, but you get the actual data you're billed against and a fairly reliable gas meter, but for per-circuit monitoring of course as you're doing.
DeleteAlso, do you know of the 'Non-Intrusive Load Monitoring' (NILM), which is how devices such Smappee or Neurio 'detect' appliances by monitoring Reactive vs Active Power being used at any given time: https://github.com/nilmtk/nilmtk
While again not as useful as actually having an energy monitor on every actual usage device/circuit, it's useful to do NILM to see what it detects as overall power vampires.
Old SMETSv1 'non-secure' meters are finally, gradually being OTA upgraded so as to report to DCC anyway - https://www.smartdcc.co.uk/our-smart-network/current-programmes/smets1-enrolment-and-adoption/ .
DeleteThis means that - as far as I know - few retailers will toss a v1 for a v2 at this stage.
In my case, I had to get our energy retailer's contractor out to upgrade our meter tails ahead of our EVSE install.
When he arrived on the day with an (incomplete) job description of "upgrade meter" which he wanted to clarify with me, I had a conversation over the phone with him about how if he really wanted to replace it with a v2 while there I'd be ok with that but that was not what I had asked to be done and ultimately would rather the existing meter worked rather than it going to waste.
I didn't speak with him again and as I wasn't on site I have no idea what he did, but not long after he had visited our readings magically started arriving with our retailer.
My suspicion is that - as the IHD only died over a year after we switched away from the supplier who's meter it was - some sort of OTA update went wrong and the comms module had needed rebooting ever since (..there is no reset button on the comms module).
The problem is that at the moment because the upgrade programme is not complete I am not sure if there is a way to know whether you simply haven't been upgraded yet or if something has gone wrong and accordingly retailers likely won't want to get involved until the rollout is declared 'finished'.
Glad to see that I am not the only one with network gear burning ~300w.
ReplyDeleteWe had a gen1 smart meter from Eon. The IHD displayed nice little graphs of past hour, day, week, month, year usage. Usage reported in kwh, £, KG co2 etc. After the meter became dumb the £ bit was inaccurate but the other data was extremely useful.
Recently we were forced to upgrade to a SMETS2 meter and I have to say I think its a load of rubbish. We get monthly meter reads now, but the monetary amounts are incorrect as our supplier hasnt updated the tariff. Usage only seems to be reported for day/week/year and is only reported in £s so stupid math is needed to work out actual usage. Only the overrall meter reading and current demand can be seen in kwh and kw. A real step backwards.
How about you register A&A as a DCC 'Other User' then design and build a zigbee energy device to send real-time high frequency data to a local MQTT server? This would be unique as far as I'm aware, as all other solutions all involve routing data to a 3rd party first. I'd be your first customer!
ReplyDeleteZigbee (well IEEE 802.15.4) is very much on my list.
DeleteI used to think smart meters an attractive idea until I realised just how intrusive they are (or might become). Yes, not having to read the meter is convenient, but do we really want some opaque, unaccountable organisation monitoring our energy usage in real-time, 24 hours a day?
ReplyDeleteGiven the failure of successive governments to secure reliable and cost-effective energy for the UK (let's rely almost entirely on intermittent wind, and expensive Russian gas with only 4 days of storage — what could possibly go wrong?), it won't surprise me in the least if smart meters become a tool for energy rationing and carbon budgets in the near future.
"Oi mate, have you got a license for that hair dryer?"
Another point about the IHD, is the range can be awful Ours doesn't work unless its right next to the cabinet.
ReplyDeleteIt just about works in the kitchen located on the other side of the wall the meter cabinet is on, and sometimes works in the dining room attached to the kitchen, but not a chance of it working in any other room of the house.
Mostly it lives in the utility room where the meter cabinet is. Works fine in there but it never gets looked at.